Summary
The following article shows an explemplary action plan, when it comes to extracting knowledge about oneself out of digital data (self quantification data), gathered by tech companies. First some basic question like data privacy and benefits of decision making based on data are adressed. Then a basic distinction of data gathering methods within the quantified self movement is presented. Afterwards instructions on how to download own data from tech companies is presented. At the end a self-case study presented as an exemplary approach.
This post is also available in:
 Deutsch (German)
  polski (Polish)
1. Context – wanting to change something, intuition fails
1.1. Intro – Self quantification
Big data or data driven enterprises are one of the most discussed topics in the business world today. You have to add, that the topics are discussed controversially. As companies own data of thousands, millions of users, they have the power to build business models around data. Data ownership increases the companies performance, data ownership creates advantages. So the assumption here is: “the more data a company owns, the more powerful the company would get”. Of course, data in itself does not define a powerful company. “Is data actionable?” is one of the important questions for companies. The assumption exists, that data increases performance or even defines business models. If data has such an impact on companies, isn’t it logical to evaluate whether data has the same impact on individuals (sneak preview: the topic is called “self quantification”)? Of course, the answer is: Yes! Let’s start with some argumentation and important assumptions on the self quantification topic. Why data is available and why it should be used for private purpose.
Remaining question like “How to get data from company A”, “how to make data readable and actionable” and “what are the questions to be answered with the help of data” will be described in the article, too.
1.2. GDPR – Law is obliging company to provide access to data
Within the EU & the GDPR, every data subject (=the user) has the right to access data saved by a company. There are many other sources, which have already described the impact the law has. In general, the law obliges companies to provide possibilities to access such data. This led to companies creating services or pages, where users have the possibility to access own data. You just need to know where to look for it on specific pages.
1.3. Disadvantages of decision making based of feelings
Our decisions as humans are not always best for ourselves, not saying best for our environment. Just think of the mathematical exercise: “132 * 18 + 23”. Some people will be able to solve it in a few seconds. Some people will need up to one minute to solve it. Some people will need a pen and a paper in order to solve it. The task is preety one dimensional and simple. It’s math.
Now think of multidimensional questions concerning our own life? Exactly, it seems unlogical to come to fast conclusions. If we make mistakes solving one dimensional math execises, how can we be sure at such a high level, when judging about more complex stuff. Such errors in cognitive evaluations where discribed and researched by many scientists, such as Daniel Kahnemann. These errors are called “cognitive biases” and they undermine decision making. Some of these biases are:
* Confirmation bias: tendency to search and save such information, which confirmes own preconceptions – Example: Many of us tend to surround ourselves with people, who have similar opinions on key questions
* Anchoring: tendency to base decision making on one specific information, missing out on others – Example: Many of us tend to judge on public happenings, based on one information source
* Availability heuristic: tendency to overestimate the probability of anything which is much more present in our heads – Example: Many of us tend to think, that terror attacks are much more likely, than they actually are
* Dunning–Kruger effect: tendency to overestimate own abilities while not being an expert and underestimate own abilities while being an expert – Example: Many of us know the people who do have an opinion on a subject, but do not have an idea about it
The list is incomplete, but shows some tendencies in our thinking processes. They are results of cognitive short-cuts, which underly our thinking processes. Cognitive short-cuts means, that our brains have developed ways to increase information processing quality & quantity. This happens by using pre-existing rules. Such pre-existing rules are used, when re-occuring information is being processed or as such evaluated. Visible examples are behaviors based on habits or do you remember where you have put down the keys to your door or your car.
1.4. Advantages of decision making based on facts (= data)
A counter-argument for using data in developing oneself might be, that oneself knows best, what is best for oneself. Indeed this seems true, but what if data could enrich, actualize or build self-knowledge? If data was able to do it, then there should be some advantages, similar to competetive advantages, which exist for data driven companies.
* Consistency: To be consistent might not always be the best decision. Of course, circumstances will have impact on consitency. But the devil in ourselves will always try to have us behave based on customary practice or based on what causes less effort.
* Awareness: To be aware of developments. Though in many cases, we do recognize when we feel sick physically or feel bad mentally, the cause is not always recognized. Sometimes our minds use defense mechanisms in order to help us functioning. Defense mechanisms do lead to not being aware of developments. Example? Running away from problems is a very basic & simple defense mechanism. It leads to not having to deal with an issue and as a consequence, not being aware of it.
* Responsiveness: To be responsive means, to act proactive in real-time at the right time. An individual may recognize, that some activities or personalities might have negative influence on own development. The recognition might take months or even years. Don’t you have that one friend, who is still in a relationship with that bad partner. Data will help to identify, control and even predict bad influences. Recognition is not the only step to be made. Based on identification of a (future) issue, acting it out is the next step.
* Build-In feedback: This means, that people get a build-in response straight out of their own life, after making changes. Of course, we do get shortterm feedback from our environment (ex. Hitting a dog, being bitten by the dog as a consequence) or our body (ex. smoking cigarettes and coughing as a consequence). The question is whether we get long term feedback and whether we think, that it were the changes made before, which caused the consequence (getting wealthier over time, caused by high conscientiousness). The build-in feedback will lead to a higher ability of adjusting mal-behaviors.
* Speed in decision making: This means, that the speed of the decision making process will increase. The increase will lead to a shorter time of living under bad influences. It will decrease the amount and strengh of bad consequences a person has to suffer from.
* Minimization of influence of biases: Cognitive biases will not be as influencial as potentially possible, as soon as data will have a controlling impact on decision making.
The list of advantages shows, that data will help in increasing the quality of decision making in private life, too.
1.5. Important assumptions
– Companies are obliged to provide access to data stored about oneself (based on EU-GDPR rules)
– Quality of decision-making is disturbed by feelings / cognitive biases (= brain shortcuts)
– Quality of decision-making is increased by data, as it portrayes life in numbers
2. Conflict – wanting to change something, don’t know how
Now, that it is clear, that data could potentially be helpful in self-development, the following questions remain:
* How does the process look like?
* What data is available and what data makes sense in respect of self-development?
* What are key performance indicators of self-development in my specifc case?
* How do i get certain data from companies, which collect it?
* How can i make data readable for the human eye?
* What are actionables of my own data?
3. Climax – the process of involving data in self-development
Before starting the process of self analysis based on digitally available data, you have to define the process in itself.
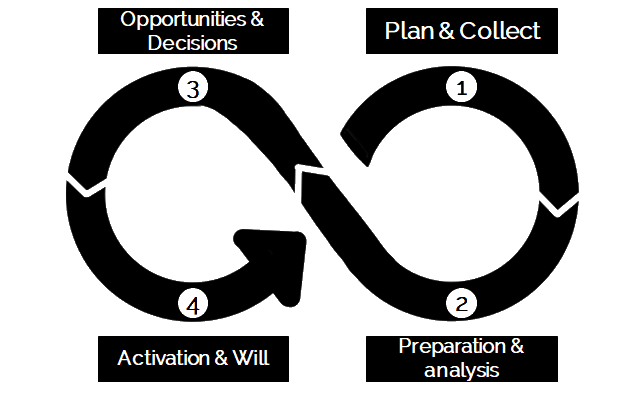
Plan & Collect
First of all the question is, which data is generally available. Then available data should be classified as sensful data to be included in self-development. To have a basis for decision making, the goals and KPIs should be defined. The next step is to determine the exact data sources to actually be involved in such a process of self development. The step plan and collect is done, when the behaviors of data collection are actually finished (Which is one of the biggest efforts, as it requires long-term commitment to data collection in multiple apps). At this point a coach can help with many tasks. First of all the KPI definition is one major task. A coach can support in the definition process. Then there is the long term process of collecting own data, which is not the most attractive task. A coach can assist in holding up the long term goal and the intrinsic motivation.
Preparation & Analysis
Next step requires data preparation and analysis. Preparation means, that the extracted data from digital applications has to be cleaned up. Cleaning data up, means bringing it into a form, which fits the general requirements. When cleaning up data from different sources, one major task is bringing data into the same format, to have it comparable. Another important task is to find the one data column, which is available in each data source. This allows to connect data from different sources. After preparation, the next step is to aggregate data.
Data aggregation means, that data is summed up, calculated, averaged etc., so that you don’t have to look at each data point (which you will have thousands of). You can look on major metrics, like averages or sums.
After data is prepared and aggregated, you can visualize data. Visualization means, displaying data in graphs, columns, pie charts etc. It makes cognition of data easier. Looking at numbers is an easy task for a trained eye. Looking at numbers is pretty exhausting task for an untrained eye. Looking at charts makes data easy to understand. The last part of analysis is the actual analysis. Analysis means, identifying patterns or deviations from a norm.
A coach, who has experience with data and data from digital sources, will be able to assist in the process of data preparation. A coach will even be able to help in the selection of right solutions for automated data preparation.
Opportunities & Decisions
The next biggest step is the decision making based on data. After having the data cleared up, aggregated, visualized and initially analyzed, possible explanations of the analysis should be evaluated. Only the person in focus will be able to truly understand the data analysis and provide an interpretation, as only the person in focus knows what happened. At this point a coach can provide support by enabling the thinking process. Based on the data and possible explanations / interpretations, decisions can be made, of course solely by the person in focus again.
Activation and Will
As a last step within the process, the decisions should be realized. They should be planned and enacted. While a one-time default process might end at this step, the infinity loop suggests, to start all over again. This is very important, as decisions and changes of average behavior will lead to a change in observable data. In order to fully understand the impact of such changes to one’s own life, data collection should start all over again.
Challenges
In all steps of the process, the MITSloan Management Review writes, “lack of understanding of how to use analytics to improve” is the main barrier to becoming a more data driven business. The same issue will probably occur with a more data driven human. Other big issues are lack of “ability to get the data”, “perceived costs overweighing projected benefits” and “not knowing where to start”. Those reasons seem not to be of technical, but more of emotional and procesual nature. Furthermore, in personal context, the data gathering upfront and in longterm implicates high efforts and high discipline. Those are emotional reasons on an intrapersonal level. On the other hand, gathering data, eg. writing down nutrition specifics, while being in social company, might lead to confrontation with friends, family and strangers. What i have often heard is “aren’t you exaggerating?” or “now concentrate on us”. Such emotional barriers can occur on an interpersonal level. Both, intrapersonal and interpersonal barriers indicate, that a coach, who will be able to assist in the process of becoming more data driven, will be a cornerstone.
3.1. Plan & Collect | Available & sensful data
3.1.1. Self-recorded data
Self-recorded data is available via wearables or mobile devices, which people carry with them. Self recorded data is also available via platforms or service providers, which are used to interact with people or things. If somebody writes a whatsapp message or posts a message on a board, this is one data point, which is gathered by the platform provider. At this point, i have to mention, that i use apple devices. Of course, devices from other manufactures should have equal capabilities.
* bio-medical data (from Apple Watch Series-4 & iPhone Xs): consumed calories, heart rate | per day, per hour
* behavioral data (from wearables, mobile devices, platforms and service providers):
** wearables/mobile devices (from Apple Watch Series-4): steps made, distance made, standing time | per day
** platforms (facebook, whatsapp, instagram, google, netflix): private messages, posts, comments, location, movie watching | per day, per hour, per person, per interaction
** service providers (mobile phone company, eg. Telekom): calling history | per day, per hour, per interaction and per person
** service providers (financial institutions, eg. VR Bank): expenditures | per interaction
3.1.2. Self-reported data
Self-reported data is is available, when a person takes care of data gathering him-/herself. It means, that no data is recorded out of the box. As an example, you might think of your weight. At least you have to stand on a balance. Some devices will sent data to an app. Mostly, you will have to write down the weight by yourself.
* objective behavioral data from apps (myfitnesspal): nutritional values of meals (eg. calories, fat, cholesterol, sugar etc. ), weight | per day
* subjective cognitive & emitional data (iMoodJournal, Happify): Mood | per interaction
3.1.3. Sensful data
The next question can be answered by asking another question “what do i want to know about myself”? Do you want to change your weight, gain or lose it? Well, you will then need track your weight. As sports & eating behavior do have impact on your weight, you will need to track your meals & your movement activities, at least. If you want to evaluate the impact of certain times or places on your well-being, you will need to track the moments you spent at such places in such times in real life. Maybe there is impact of nutrition on your mood? What about the impact of internet usage? How about the impact of certain people? Click here to take a look at what data is in general available.
3.2. Plan & Collect | My specific key performance indicators (KPIs)
Well, during the time, that i first decided to create such a self-analysis, i’ve had health issues. Both my house-doctor as well as 2 neurologists told me, that one possible explanation for my health issues was stress. So when thinking about Goals and KPIs i decided to concentrate on Hearth Rate Variability and my mood.
Furthermore, i identified my weight and eating behavior as “not on an optimal level”. I have tried out low carb diets as well as gluten free diets just for fun in the past and was pretty succesful with them. But then, after not having any active goal with such initiatives, i stopped having an actively managed diet. In combination with me stopping smoking, my weight increased by 10 kilograms within half a year. So a pretty obvious approach was to have a look at my nutrition.
As i did decide to not have any persons included in my public analysis, i skipped the analysis of calling and messaging behavior and comparing it to mood or HRV.
I skipped analysing my internet usage, too. Not due to moral or practical reasons, but due to lack of data available. Though devices do save usage data, i decided to use specific tools, which will help me analyze my usage cross-device. Such a solution is rescue-time. I started using rescue time in July 2019, while doing the other analysis from April to June 2019.
3.2.1. Mood per Time & Place
To analyze my mood in combination with times and places, self reported data is necessary. The solution of my choice is pretty simple and at the same time pretty powerful: iMood. It allows to save mood on a scale from 1 to 10, with 1 being bad mood and 10 being very good mood. It allows to provide mood indicators with hashtags in order to label certain mood points, but i did not use this feature. Mood per Time & Place allows me to analyze how my mood changes, when being at certain places and times.
In order to track the geo location (=place) i have used the out of the box function of facebook. The facebook export function allows to use geo location based on dates.
3.2.2. Heart Rate Variability per Time & Place
I have choosen heart rate variability in order to have an indicator for stress. As mood is the positive, stress might be an indicator from a negative perspective. Heart rate variability connects with regions of the brain, which are involved in stress appraisals. The general conclusion is therefore, that stress might have impact on the heart rate variability. A rule of thumb to use is the following: the higher the heart rate variability is, the lower should be the indicated stress level. But always keep in mind, that the HRV should be looked at in a person specific context. This means, that a HRV of 50 for person A might not lead to the same interpretation as for person B.
In order to track the geo location (=place) i have used the out of the box function of facebook. The facebook export function allows to use geo location based on dates.
3.2.3. Weight per calories and macro nutritiants
This statistic depends on self reported data from myfitnesspal. There are many nutrition trackers and for me myfitnesspal is the best. It has some premium features, especially the data export feature is important for my own use case. How does it work? Well, you search for a food ingredient, select the amount of grams and all the micro & macro nutritients will be saved. This is important, as it helps to regulate eating behavior and identify potentials for improvement. As with all statistics, you always have to keep in mind to evaluate data based on the specifics of person specific context.
In order to track weight, i have bought a wifi and bluetooth compatible weighbridge, which allows me to save all progress within an app and compare that data.
3.2.4. Weight per activity level
When evaluating basic health measures, such as mood from a psychological viewpoint and weight or heartrate from a physiological viewpoint, it makes sense to take a look at participation in sports or other activity. In my case, weight will evaluated as a function of eating behavior and participation in sports.
In order to track weight, i have bought a wifi and bluetooth compatible weighbridge, which allows me to save all progress within app and compare that data.
3.2.5. Mood & Heart rate variability per person (family & friends)
As mentioned before, this would be immoral, therefore i decided to not conduct such an analysis. Data to be used for such an analysis is available at Whatsapp (which allows you to export a chatlog), at Facebook (which allows you to export a chatlog), at your telecommunication provider (which allows you to export calling history).
3.2.6. Digital Activity
In order to understand potentials of own behavior at work, at home, with private projects, people could analyze their behavior within the digital world. One possibility is to access data saved by devices. My goal is to analyze my behavior based on my usage within different devices, therefore i will use an out of the box tracking and aggregation service, like rescue time.
3.3. Plan & Collect | How to get access to data? (Skip this section, if you know how to export data)
3.3.1. Prerequisite: How to deal with .csv, .json, .xml files
Most data will be exported as .csv, .json or .xml files. The goal in this case study is to use Microsoft Excel as the most commonly used software. Therefore the main task is to open all three file formats in microsoft excel. Every file format requires an individual approach in order to convert data into .xlsx format.
3.3.2. Data from MyFitnessPal
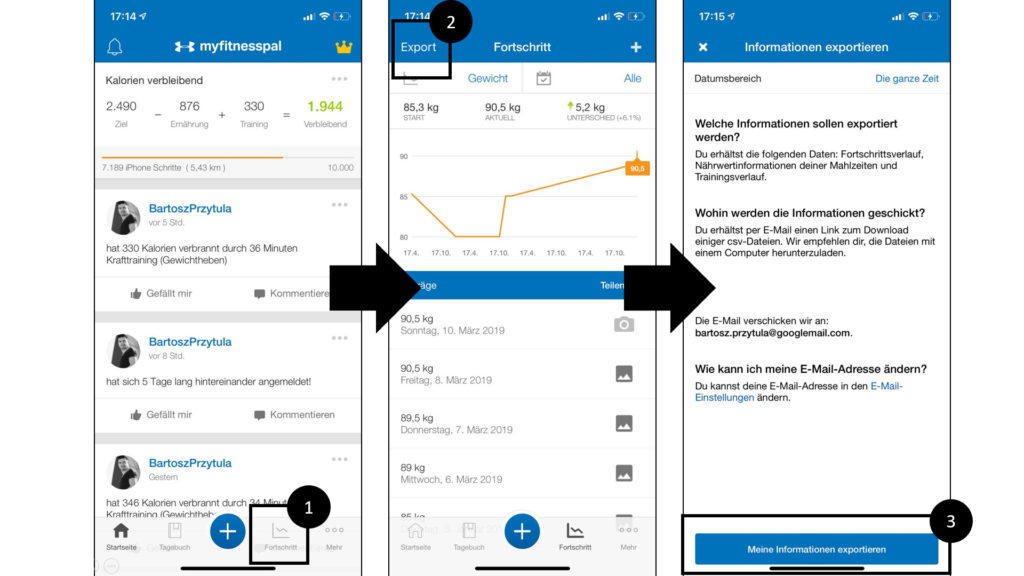
To export data from MyFitnessPal, the following steps have to be taken after opening the mobile app:
1. Click on “Fortschritt” within the bottom line navigation in order to open next app-view
2. Click on “Export” in the upper right corner in order to open export-view
3. Click on “meine Informationen exportieren” within the bottom line in order to generate data export
-> Export: a comma-separated value (.csv) file.
3.3.3. Data from Facebook
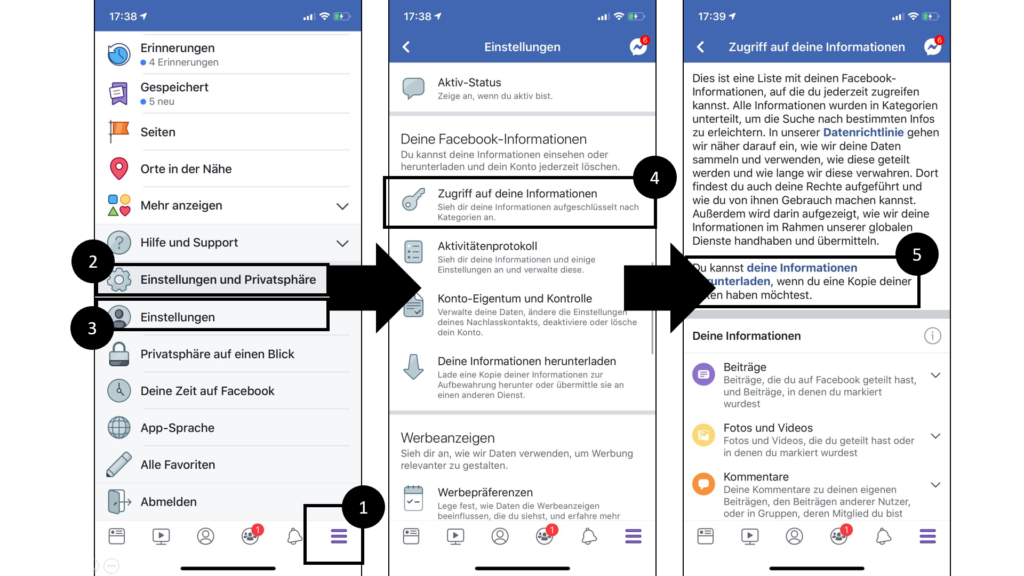
To export data from Facebook, the following steps have to be taken after opening the mobile app:
1. Click on the “3 horizontal stripes” within the bottom line navigation in order to open the navigation
2. Click on “Einstellungen und Privatsphäre” within the navigation in order to open sub-menu items
3. Click on “Einstellungen” within the sub-menu in order to open the next app-view
4. Click on “Zugriff auf deine Informationen” within the sub-menu in order to open the next app-view
5. Click on the text-link “deine Informationen herunterladen” in order to open the data-export view
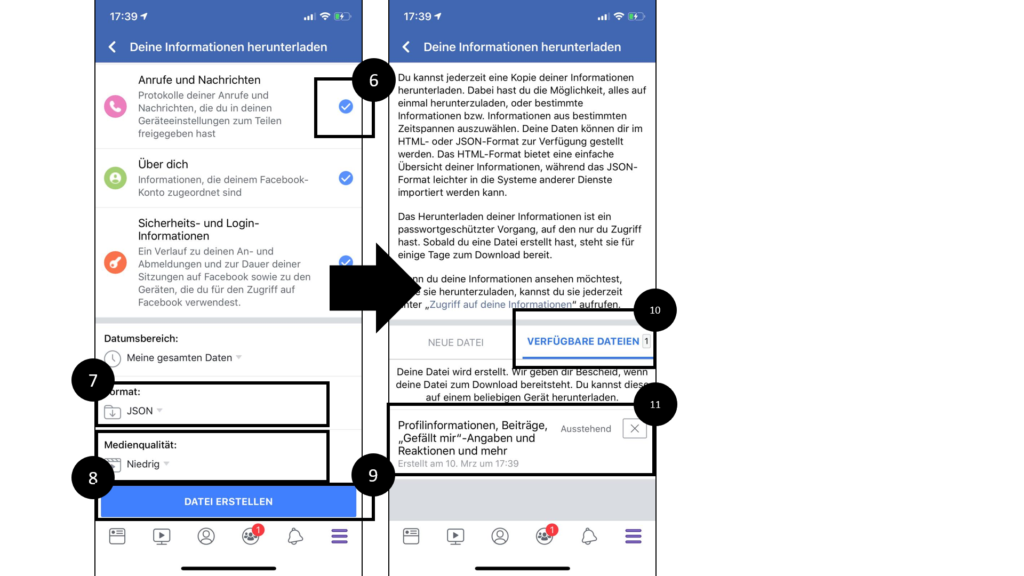
6. Click on all “check-marks” for information you want to download
7.-8. Choose “JSON” as format. Choose “Niedrig” as Medienqualität
9. Click on “Datei erstellen” within the bottom line in order to generate data export
10.-11. Click on “meine Informationen exportieren” within the bottom line in order to generate data export
-> Export: many JSON (.json) files.
3.3.4. Data from Apple Health
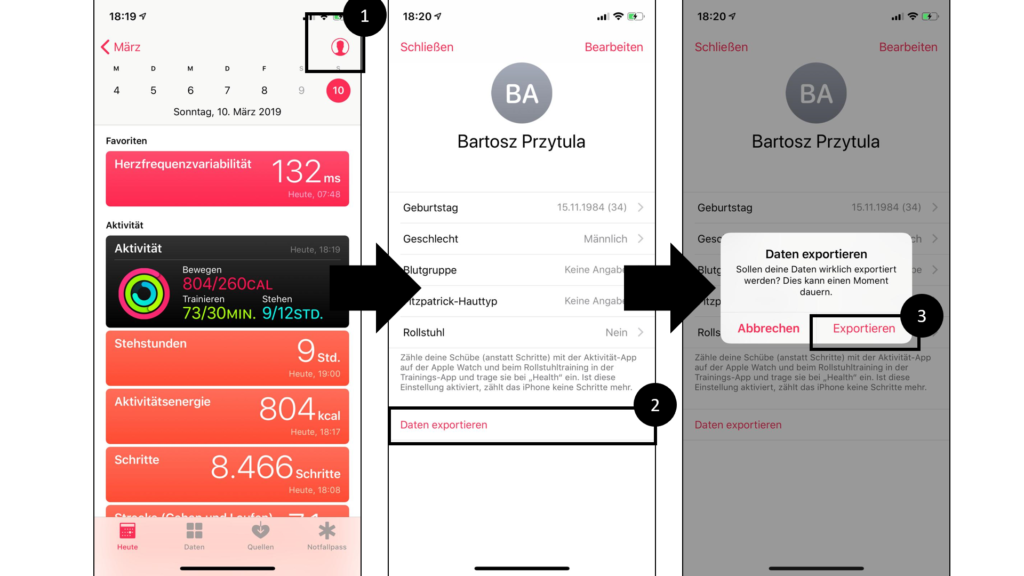
To export data from the Apple Health app, the following steps have to be taken after opening the mobile app:
1. Click on the profile icon in the upper right corner in order to open next app-view
2. Click on “Daten exportieren” in the lower area in order to open the data generation layer
3. Click on “Exportieren” within the layer in order to generate data export
-> Export: some XML (.xml) files.
3.3.5. Data from QS Access
![[OWN ILLUSTRATION] QS-Access-DataRequest](https://coach-in-business.com/wp-content/uploads/2019/03/OWN-ILLUSTRATION-QS-Access-DataRequest-1024x576.png)
To export data from the Apple Health app, the following steps have to be taken after opening the mobile app:
1. Download the QS Access application from any app store and open it
2. Slide to active any category that should be included in the data export
3. Click on “Create Table” within the bottom area of the app in order to generate the export
4. Click on “export icon” in the upper right corner in order to send or save the export
-> Export: a comma-separated value (.csv) file.
3.3.6. Data from iMoodJournal
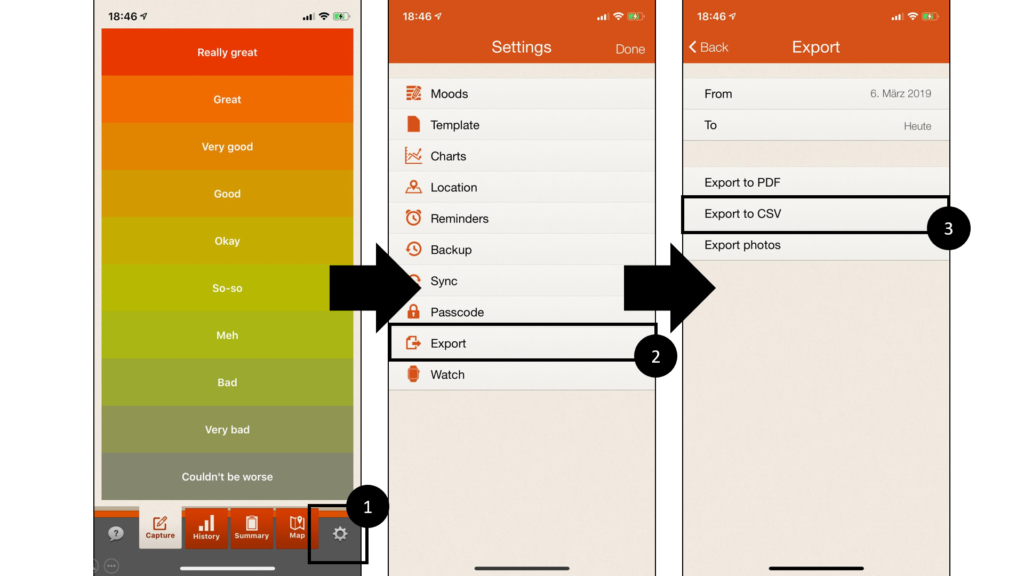
To export data from iMoodJournal, the following steps have to be taken after opening the mobile app:
1. Click on the settings icon within the bottom line navigation in order to open the settings-view
2. Click on “Export” in order to open export-view
3. Click on “Export to CSV” in order to generate data export
-> Export: a comma-separated value (.csv) file.
3.4. Preparation & Analysis | How to make all data readable for the human eye
3.4.1. Data preparation
In order to work with the data extracted from different sources, it is important to have it available in a consistent form. Single tasks within this step are the following:
* Data should have the same format
* Data values should have the same format for equal information
* Data should have the same units for equal information
* Data should have the same reference in order to compare it
3.4.2. Data aggregation
Data aggregation means, that raw data should be aggregated into sensful metrics. Sensful metrics depend on the previously defined KPIs and goals. As a first steps, depending on KPIs and metrics, it might make sense to calculate averages, sums, min and max values. Furthermore it might make sense to calculate correlations and significance in order to understand coexistance. The next step is to recalculate raw data, so that it becomes readable data. For example grams of fat, protein and carbs should be recalculated into calories and compared to each other within a share. Dates should be recalculated as calendarweeks, weekdays etc.. Geo-codes should be translated into real city names.
Typical aggregation for self quantification is:
* Data should be aggregated to averages
* Data should be aggregated to sums
* Data should be aggregated to min and max values
* Data should be aggregated to correlations
* Raw Data should be recalculated
3.4.3. Data visualization
The next step is data visualization. Data visualization means, that the available data should be displayed in visually understandable format. There are indifinite formats available. The most known are pie charts, columns and timelines. I have videotaped and screenshoted the results of such a process below
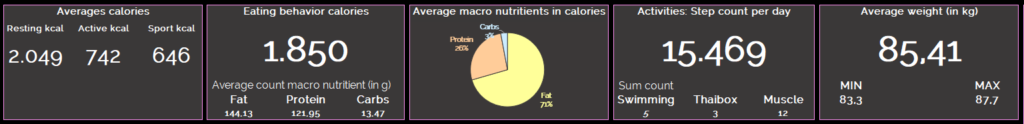
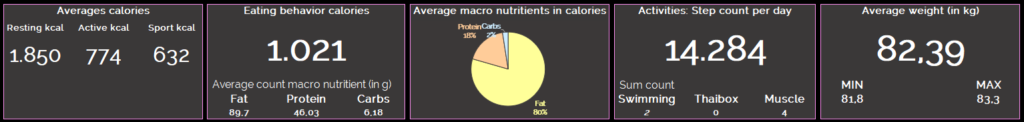
3.4.4. The result
Below an example my own, self developed, automated dashboard.
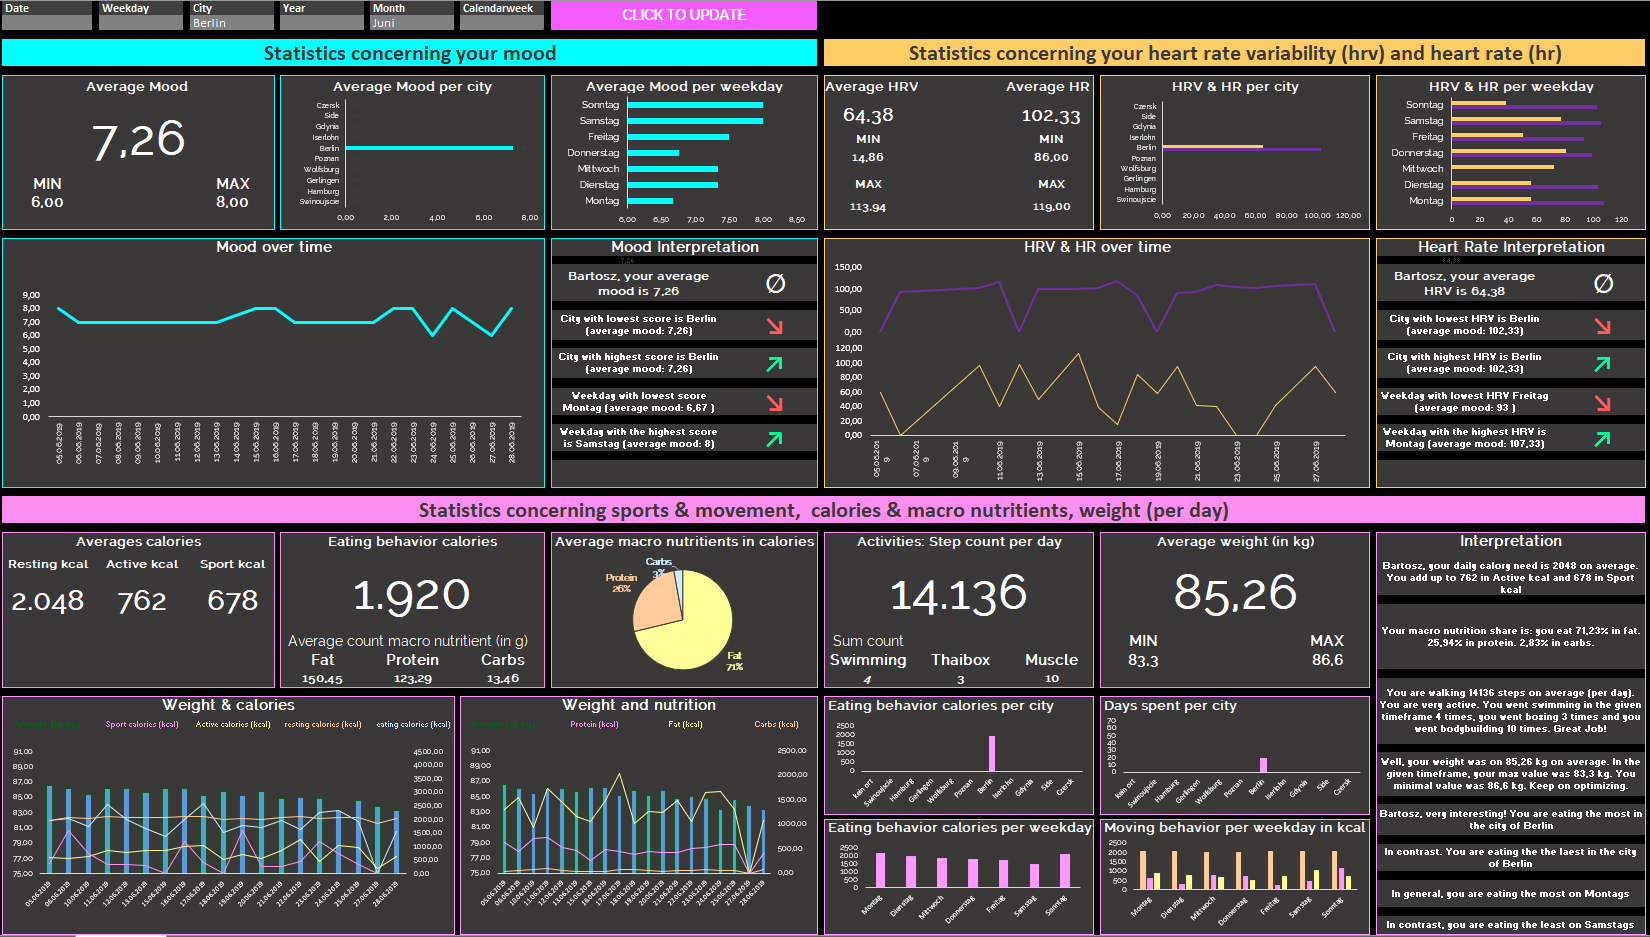
The dashboard has some advantages.
* Easy re-import of additional data: additional data (eg. new months available) can be imported and re-integrated easily
* Easy addition of new data: new data, eg. web usage data, can be important easily, as dashboard is modular based
* Easy segmentation: dashboard is adjustable to certain timeframes and cities
* Availability for another person: Dashboard can be re-used for another person, who has access to the same data
* Visual and descriptive elements: Dashboard provides visual display as well as descriptive interpretation of most important values
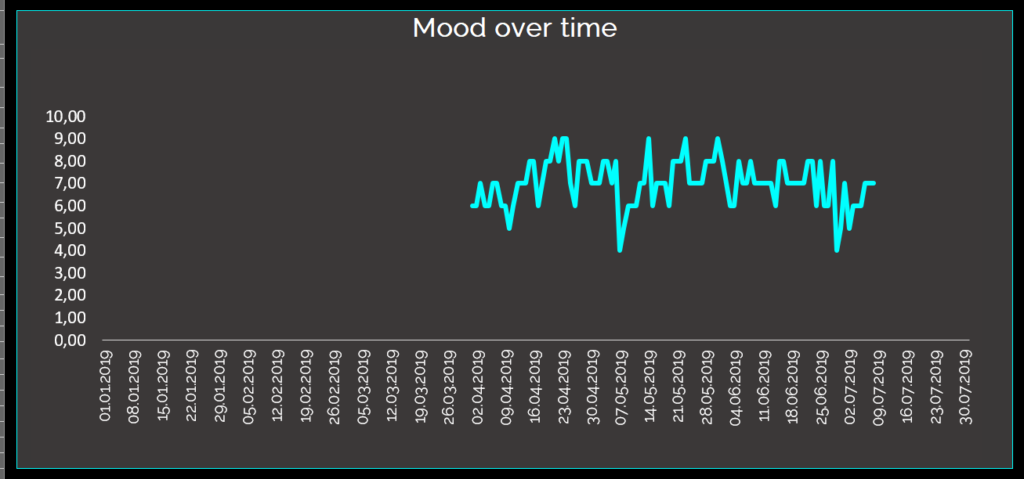
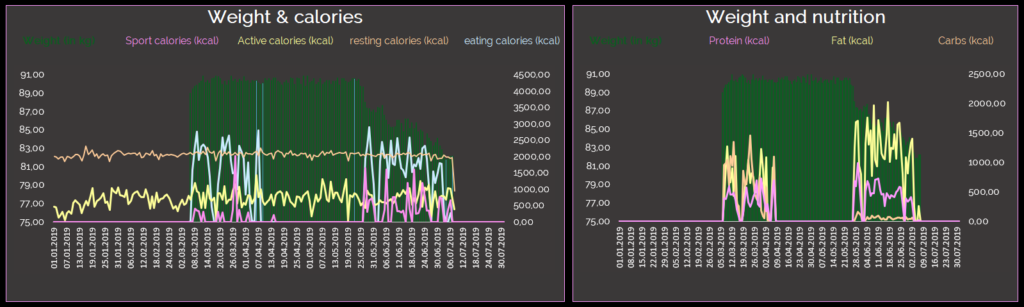
I have used timelines in order to display developments over time, such as my mood development, such as the heart rate variability, such as my weight over time.
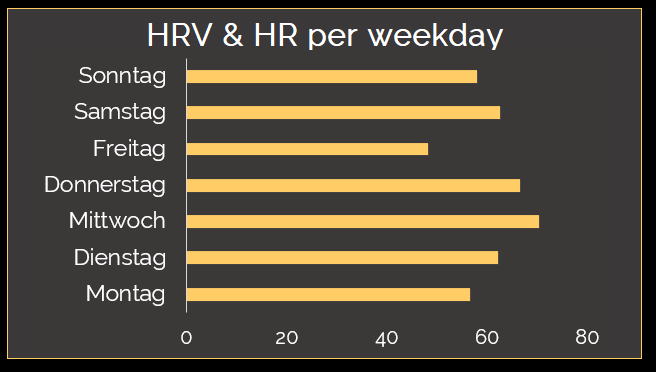
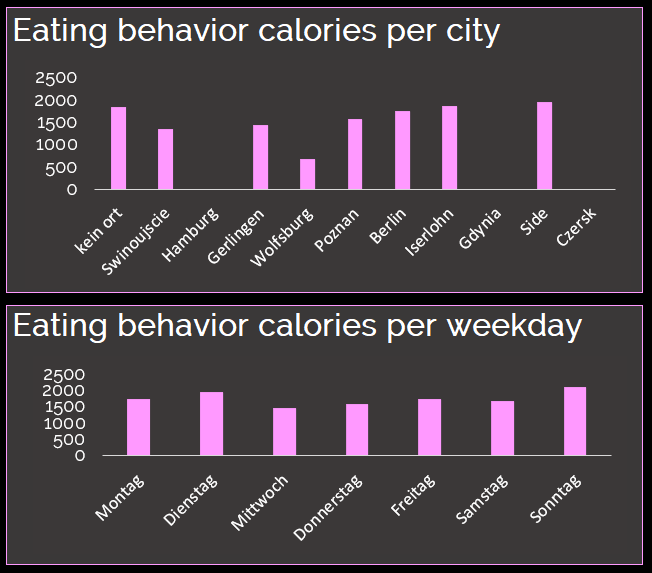
I have used columns in order to display comparisons between values for different cities or weekdays.
I have used pie charts in order to display distribution / shares.
Furthermore i have always started with displaying main KPIs on average or in sum, as it allows to set reference points in analyzing the timelines, columns and pie charts.
The dashboard can be bought as part of my service.
3.5. Preparation & Analysis | What are actionables based on my data?
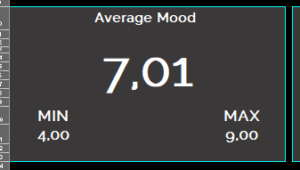
3.5.1. Mood
No negative extremes:
My data indicates, that i have an average mood of 7.01 on a scale from 1 to 10. My min Value is 4 and my Max value is 9. For me this means, that i have a tendency, not to fall into negative extremes. Throughout my life, i have already been in such places (as probably most people) and i know how hard it is down there. Therefore it is pretty difficult, to get me “upset”. So having a relatively high average is not a surprise for me.
Furthermore, i know that i have a way to evaluate things cognitively in a pretty positive matter – this means, that i naturally try to think of chances while being in difficult situations. Additionally, i have an inner locus of control, which means that good and bad events, i try to understand as a function of my own behavior.
Stable with high emotionality on both ends:
Interestingly, my mood is stable over time. It does not show any tendency or trend. It is neither positive nor negative and does not stay positive or negative over a longer period of time. On the other hand, my emotionality does vary from 4 to 9, which is kind of describing my reality. When you interact with me, i love being extraordinary motivating for other people, but at the same time i am capable of negatively triggering others (i love to argue a lot). So i am highly emotionally engaged in everything, that i do.
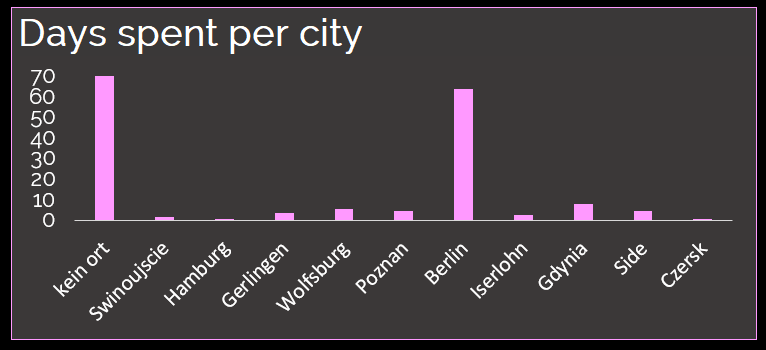
Better mood, where family and friends are:
While analyzing places, that i’ve been visiting, it became obvious to me. Places, where family and friends live, do lead to a better mood for me. This sounds logical, as such places are additionaly disconnected from daily life (in my case). Czersk, Side, Gdynia & Iserlohn are in the Top5, in addition to my homebase Berlin. Side is where i spent vacations with my whole family. Czersk is, where my granny lives and my dad lived. Gdynia is where my other granny lives and my heart belongs. Iserlohn is where i grew up and my mother lives. On the other end of the spectrum, there are cities which are directly connected to my educational progress or my business life as an employee. Poznan is where i have studied psychology (and being there, i either spent 26 out of 48 hours of a weekend sitting in classes or writing exams). Wolfsburg is where my main consulting-client has his headquarter. Gerlingen is, where my employeur has his headquarter and Hamburg is, where i had to travel once for work. Furthermore very low on the mood scale was the city of Swinoujscie (Me and my girlfriend argued a lot in Swinoujscie). The hypothesis would be, that social bonding and integration is a predictor for me to have good mood.
I have to underly the fact, that in the given analyzed timeperiod, i have spent only 1 day in Czersk, 2 days in Swinoujscie & Hamburg, something between 2 & 5 days in Gerlingen and Iserlohn. Therefore those cities might not display a proper average score. “Kein Ort” is where no place was recorded, because the geo location feature within facebook was turned off.

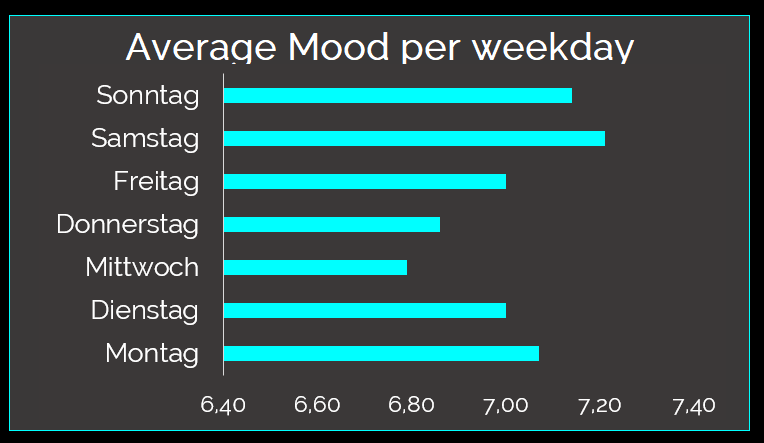
Better mood around the weekend
When it comes to weekdays, mid of the week (with tuesdays, wednesdays and thursdays) seem to be less attractive to me. My mood is lower compared to fridays, saturdays, sundays and mondays. This seems obvious, as weekends are correlated with visiting friends and family, of course. Furthermore weekends allow to concentrate on things you want to do and not things you are obliged to do. Especially wednesday is low on the mood scale. In my case wednesday is the day of business travelling and sitting in meetings, which makes wednesday the least productive day in the week for me.
3.5.2. HRV
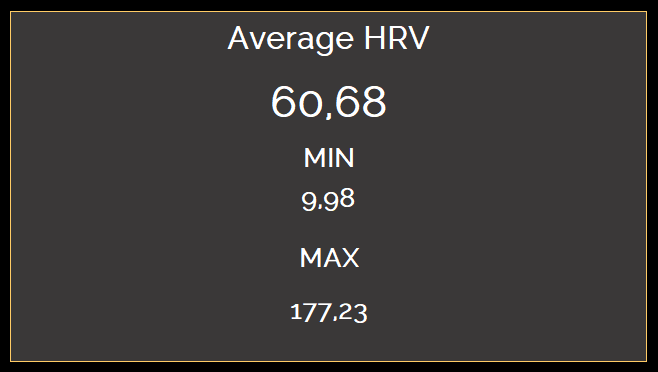
Average and Min / Max Values indicate “i’m average”
Heart rate variability as an indicator of stress shows an average value of 60.68, which is according to different sources, the average value for humans of my gender and my age. Heart Rate Variability is a less subjective indicator, as it is recorded automatically and proven scientifically to be an indicator for stress. I will not discuss heart rate
HRV does not match mood per city indicators completely
Most of the HRV scores per city are higher for cities, for which my mood was higher on average. The only exception is Iserlohn, where my mood is very high, at the same time my HRV is relatively low. Iserlohn is connected to my family, especially my mother. My mother and I, we use to argue a lot, which sometimes turns into emotionally heated discussions. Still both, we like our discussions, even if excessive. Therefore it seems, that the time in Iserlohn might be cognitively very positive and at the same time relatively stressful. Furthermore, Poznan, Wolfsburg and Hamburg have the lowest values. Side, Gdynia and Berlin have the highest values. Gerlingen does stand out as the second highest value.

HRV does not match mood per weekday indicators completely
Fridays and mondays have the lowest HRV. This is in so far interesting, as Mood is relatively high on mondays and fridays. Though mondays and fridays can be distinguished from saturday an sunday, as they are working days.
HRV is stable over time
My heart rate variability is stable over time and does not show any positive or negative tendencies. A little rising tendency is visible in june & july.

3.5.3. Nutrition and Movement
Overall i am stable
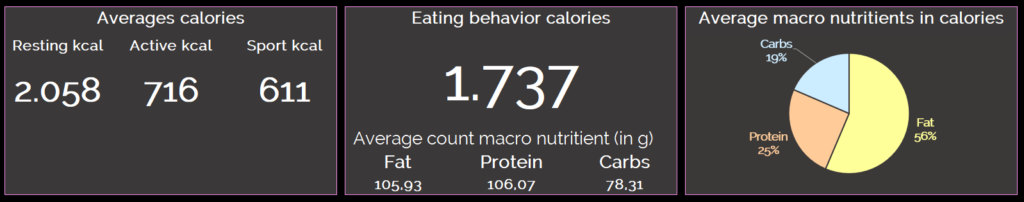
On average i need 2.058 calories, while i build it up by activity calories (probably walking 12.968 steps a day, with 716 kcal on average) and sport calories by swimming, thaiboxing and going to the gym (611 kcal on average). On the other hand i eat on average for 1.737 calories. The average for eating calories is not proper, as i started recording exactly everything my diet consists of in mid of april. Therefore the macronutrition share does not show, how i composed my diet over time. On average i consumed 56% fat, 25% protein and 19% carbs when compared in calories, which led to an average weight of 88,57 kilograms. Min and Max values for my weight (Min: 81.8, Max: 90.9) indicate, that there might have been changes to my sports as well as my nutrition. Let’s take a closer look.
Zooming into months, there is a change visible
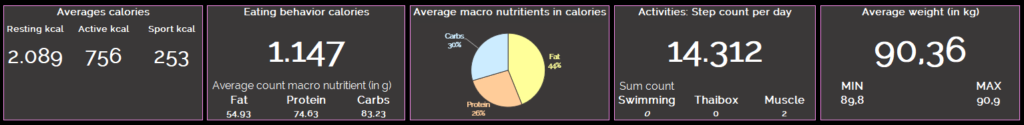
In April my nutrition share was Fat: 44%; Protein: 26%; Carbs: 30%. It shows an increased share of carbs, compared to the overal average. At the same time my average weight was 90.36 kg, which is nearly equal to the max value. I was not as active when it comes to sports, as the previous months. Mood in April was on avergae, but i had an increased average HRV, compared to what is expected, for somebody like me.
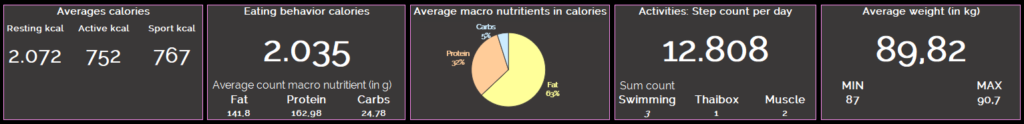
In May the situation changed. I introduced swimming & thaiboxing to my sports activities. Furthermore i decreased the carbs share to 5%, while increasing protein (32%) and fat (63%). I was eating 2035 calories on average. My goal was to go on a keto diet. apperantly it did not change my weight directly, though i have lost some grams. My average mood stayed stable, but my HRV decreased. This might or might not be connected to the change in nutrition.
In June, i came pretty close to a nutrition share, which defines a keto diet. Fat was equal to 71% in calories, protein was 26% in calories and carbs was 3% in calories. Additionaly my average calory consumption went down to 1850 calories. I started working out more intensly, with 5 swimming days, 3 thaiboxing days and 12 gym days during june. My step number increased, compared to previous months, while my average mood decreased a little bit. My HRV alligned with the average for a male with my age. My weight went down to about 85.41 kg.
In July my diet became even more extreme. My nutrition share went up to 80% for fat, with 18% for protein and 2% for carbs. At the end of the month, i went down to 82,39 kg on average.
The change is visible in:
a) Diversifying sports behavior: I have added swimming and thaiboxing
b) More frequent sports behavior: By adding new sports, i’ve started to work out more frequently
c) Being more “active”: by doing more steps on average
d) Decreased my carbs calories: By leaving out major carb sources, like pizza, bread, spaghetti, rice
e) increased my fat calories: By adding such things as Avocado, bacon, steaks etc.
f) Weight decrease: Decreased my weight by combining a) to e)
Dieting is difficult, when on the road
If i take a look at my dieting behavior, while being on a trip, it becomes ovious, that i either do not eat at all (in Wolfsburg for example), which might have impact on HRV and mood. Or, i might eat a lot, sometimes too much, as in Side and Iserlohn. In Side, where i was on vacation with my family. The trip was all-inclusive, so eating 4 times a day was the highlight of the trip. In Iserlohn, i am at my mother’s, who has always everything ready to give me a good feeling. It shows me, that my challenge is, to take care of my dieting when i am on the road. The same picture is displayed, when looking at weekdays. I’m not eating enough, when in Wolfsburg on Wednesdays and i am eating too much, when being on the road on saturdays and sundays especially.
4. Conclusion – Opportunities & decisions
4.1. More data (usage data rescue time)
As i skipped connecting mood & HRV to specific individuals, by connecting the dots to Phone-Calling and social networking behavior and as i skipped analysing my digital usage, i will prepare deeper analysis in step 2 of my self quantificatoin use case.
Digital usage behavior: In order to accomplish the analysis, i will get back to data of screen trackers (like rescue time), to data app device providers (like apple) and to data of platform providers (like facebook).
Interaction with inidividuals: In order to accomplish the analysis, i will get back to data of social networks (like Facebook & whatsapp) or messengers (like facebook). I am not sure though, whether i will publicly provide the analysis.
4.2. Work cognitively and behavioraly on evaluation of less positive moments
As my goal is to increase my mood and decrease my stress, i need to work on both. Cities with the highest potential show low mood and high stress, indicated by the HRV. The question is how mood can be increased proactively and stress decreased. Well the easiest way is to work cognitively and behavioraly on crushing, updating, changing, developing patterns.
I have good mood in cities, where family members or friends live. I’m fully integrated into those social circles. In cities, where i work, i am not fully integrated. This is not due to me being a social outsider. This is due to me choosing not to invest so many time into social bonds at work. It seems that there is an open potential. I will try to invest more emotions and time into my co-workers and will then try to observe, whether my mood indicators change. One way to trigger such a change process is to start judging people not as colleagues at work, but as friends.
When it comes to the stress indicator HRV, it would be easy to stop arguying, while being in Iserlohn, but as i said, i do like the discussions with my mother. So it seems to be a specific kind of stress. Furthermore, in Wolfsburg especially, as one of my “cities, where i work”, i will need to work on my perception of people. I do have an issue with power solely based on hierarchies and where i work, such a concept is one of the main decision making drivers. I have an issue with pseudo authority. I will need to step into the shoes of other people in order to understand their way to power, in order to understand their motivation for behavior, in order to be more easy-going, when it comes to difficult situations. Well sounds like this is the bad part of me being very emotionally connected to everything, that i do. When i do things i like, i am probably very motivating for others, but when i do things i don’t like or disrespect, i might tend to not being the most empathic person on earth.
4.3. Change nutrition (stop dieting) and take a closer look what happens
What i have observed, is a change of weight due to changes in macro nutrition share and sports behavior. I have decreased my overall calories count, i have increased calories driven by fat and decreased calories driven by carbs. Right now, i am at a point, where my diet is pretty difficult and requires high level of discipline. As i have driven down my weight to approximately 80kg, i want to find a way live within a diet, which allows me to eat more carbs (icecream, more vegetables, more fruits, sometimes a pizza). I think, will get into a trial and error phase, while observing the changes. Probably, i will start by increasing carbs by 10% every one or two weeks and analyze effects. The goal is, again, to find a nutrition share and callories count, which allows me to live as free from eating restrictions as possible, while staying shaped, as today. Of course, i will take a look into vitamines. Dieting should be observed and planned properly. As i started with my keto diet, i forgot to include roughage. Roughage is necessary to have a healthy bowel movement.
4.4. Active Sports & Dieting at work and on weekends
Well, what i have learned about being on work or private trips, is that i don’t do sports as frequent and that i don’t eat enough calories with the same exact target nutrition share. Some ideas to improve such a behaviors:
* Sports without equipment: Learn sports and training types, which can be done without ANY equipment. Stretching exercises, yoga, self weight exercised, running.
* Hotels with sport opprtuinties: book hotels, where being sporty is possible. Fitness rooms, tennis courts, swimming pools are possibilities.
* Plan dieting for trips: you can’t take bottles into plane, but you can take already prepared meals into planes, traines, cars and on foot-walks. I will have to learn how to plan and prepare meals upfront.
Multimedia
This post is also available in:
Deutsch (German) polski (Polish)
